Order
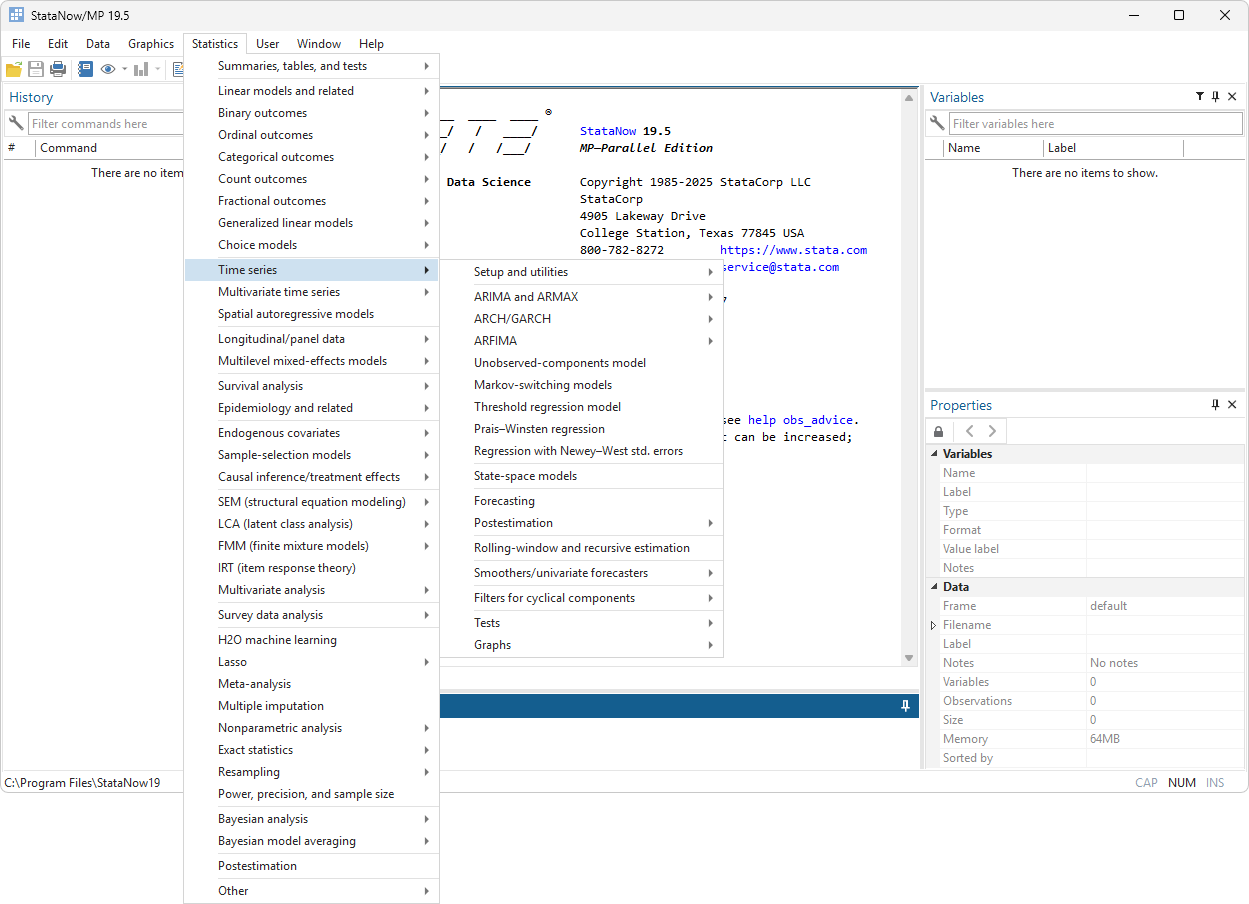
Time series
Handle all the statistical challenges inherent to time-series
data—autocorrelations, common factors, autoregressive
conditional heteroskedasticity, unit roots, cointegration, and
much more. From graphing and filtering to fitting complex
multivariate models, let Stata reveal the structure in your
time-series data.
ARIMA 
- ARMA
- ARMAX
- Standard and robust variance estimates
- Static and dynamic forecasts
- Linear constraints
- Multiplicative seasonal ARIMA
- Spectral densities
- Impulse–response functions (IRFs)
- Parametric autocorrelation estimates and graphs
- Check stability conditions
- Model selection criteria
New
ARCH/GARCH 
- GARCH
- APARCH
- EGARCH
- NARCH
- AARCH
- GJR and more
- ARCH in mean
- Standard and robust variance estimates
- Normal, Student's t, or generalized error distribution
- Multiplicative deterministic heteroskedasticity
- Static and dynamic forecasts
- Linear constraints
Multivariate GARCH
- Diagonal VECH models
- Conditional correlation models
- Constant conditional correlation
- Dynamic conditional correlation
- Varying conditional correlation
- Multivariate normal or multivariate Student's t errors
- Standard and robust variance estimates
- Static and dynamic forecasts
- Linear constraints
Markov-switching models
- Dynamic regression
- Autoregression
- Tables of transition probabilities
- Tables of expected durations
- Standard and robust variance estimates
ARFIMA
- Long-memory processes
- Fractional integration
- Standard and robust variance estimates
- Static and dynamic forecasts
- Linear constraints
- Spectral densities
- Impulse–response functions (IRFs)
- Parametric autocorrelation estimates and graphs
- Model selection criteria
New
Regression with AR(1) disturbances
- Heteroskedasticity-and-autocorrelation-consistent covariance matrices
- Cochrane–Orcutt/Prais–Winsten methods
- ARMA/ARIMA estimators
- ARCH estimators
Unobserved components model (UCM)
- Trend-cycle decomposition
- Stochastic cycles
- Estimation by state-space methods
- Standard and robust variance estimates
- Static and dynamic forecasts
- Linear constraints
- Spectral densities
FRED data
- Over 566,000 U.S. and international
economic and financial time series
- Search or browse by subject, title,
or source
- Download directly into Stata
- Put series on a common periodicity
- Easily update datasets containing dozens,
or even hundreds, of series
- Easy-to-use interface for searching and
browsing
- Commands for updating datasets and replicability
Business calendars
- Define your own calendars
- Create calendar from dataset
- Format variables using business calendar format
- Convert between business dates and regular dates
- Lags and leads calculated according to calendar
Graphs and tables
- Autocorrelations and partial correlations
- Cross-correlations
- Cumulative sample spectral density
- Periodograms
- Line plots
- Range plot with lines
- Patterns of missing data
Time-series functions
- String conversion to date: daily, weekly, monthly, quarterly, half-yearly, yearly
- Dates and times from numeric arguments
- Date and time literal support
- Periodicity conversion, e.g., daily date to quarterly
- Date and time ranges
Time-series operators 
- L, lag
- F, leads
- D, differences
- S#, seasonal lag
Time-series time and date formats 
- Default formats for clock-time daily, weekly, monthly, quarterly, half-yearly, yearly
- High-frequency data with millisecond resolution
- User-specified formats
Time-series filters
- Baxter–King band-pass filter
- Butterworth high-pass filter
- Christiano–Fitzgerald band-pass filter
- Hodrick–Prescott high-pass filter
Time-series smoothers 
- Moving average (MA)
- Single exponential
- Double exponential
- Holt–Winters nonseasonal exponential
- Holt–Winters seasonal exponential
- Nonlinear
- Forecasting and smoothing
Support for Haver Analytics database 
- Import haver command makes using Haver datasets even easier
- Quickly access worldwide economics and financial datasets
See tests, predictions, and effects.
See New in Stata 18 to learn about what was added in Stata 18.