1 item has been added to your cart.
Time series
Handle the statistical challenges inherent to time-series
data—autocorrelations, common factors, autoregressive
conditional heteroskedasticity, unit roots, cointegration, and much
more. Analyze univariate time series using ARIMA, ARFIMA,
Markov-switching models, ARCH and GARCH models, and
unobserved-components models. Compare ARIMA or ARFIMA models using AIC,
BIC, and HQIC, and select the best
number of autoregressive and moving-average terms. Analyze multivariate time series using
VAR, structural VAR, instrumental-variables (proxy) structural VAR, VEC, multivariate GARCH,
dynamic-factor models, and state-space models. Compute and graph impulse responses. Estimate IRFs via local projections. Test for unit roots. Perform Bayesian time-series analysis.
Forecasting
Build multiequation models, and produce forecasts of levels, trends, rates,
etc. Whether you have a small model with a few equations or a complete model
of the economy with thousands of equations, Stata can help you build that
model and produce forecasts. Your model can include both estimated
relationships and known identities. You can easily create and compare
forecasts under different scenarios, create static and dynamic forecasts, and
even estimate stochastic confidence intervals. You can create your model by
using an intuitive command syntax or by using the interactive forecasting
control panel.
Panel data
Take full advantage of the extra information that panel data provide while
simultaneously handling the peculiarities of panel data. Study the
time-invariant features within each panel, the relationships across panels,
and how outcomes of interest change over time. Fit linear models or nonlinear
models for binary, count, ordinal, censored, or survival outcomes with
fixed-effects, random-effects, or population-averaged estimators. Fit correlated random-effects models. Fit linear
models with high-dimensional fixed effects. Fit dynamic models, vector autoregressive models, or models with endogeneity. Fit Bayesian panel-data models.
Bayesian analysis
Perform Bayesian econometrics
analysis using one of the Markov chain Monte Carlo
(MCMC) methods. You can choose from various supported models, such as
panel-data, hierarchical, VAR, and DSGE models, or you can even program
your own. Extensive tools are available to check convergence, including
multiple chains. Compute posterior mean estimates and credible
intervals for model parameters and functions of model parameters. You
can perform both interval- and model-based hypothesis testing. Compare
models using Bayes factors. Compute model fit using posterior predictive
values. Generate predictions and forecasts. If you want to account for
model uncertainty in your regression model, use Bayesian model averaging.
Use Bayesian variable selection for linear regression to identify predictors
important to your outcome and perform Bayesian inference.
Machine learning
With machine learning via H2O, you can use ensemble decision trees—random
forests and gradient boosting machines—for regression
and classification. Or use lasso for sparse regression and classification.
Or use Bayesian variable selection or Bayesian model averaging to select
predictors in a linear model.
For causal inference with machine learning, use double-selection lasso,
partialing-out lasso, and double machine learning. You can use PCA or
kmeans, kmedians, or hierarchical clustering for unsupervised learning.
And use search to find community-contributed commands for neural
networks, support vector machines, graphical lasso, text mining, and more.
Programming
Want to program your own commands to perform estimation,
perform data manipulation, or implement other new features?
Stata is programmable, and thousands of Stata users have
implemented and published thousands of community-contributed commands.
These commands look and act just like official Stata commands
and are easily installed for free over the Internet from within
Stata. A unique feature of Stata's programming environment is Mata,
a fast and compiled language with support for matrix types. Of course, it has
all the advanced matrix operations you need. It also has access to
the power of LAPACK. What's more, it has built-in solvers and optimizers
to make implementing your own maximum likelihood, GMM, or other
estimators easier. And you can leverage all of Stata's estimation and
other features from within Mata. Many of Stata's official commands are
themselves implemented in Mata.
PyStata—Python integration
Interact Stata code with Python code. You can seamlessly pass data and results
between Stata and Python. You can use Stata within Jupyter Notebook and other
IPython environments. You can call Python libraries such as NumPy, matplotlib,
Scrapy, scikit-learn, and more from Stata. You can use Stata analyses from
within Python.
Import and export data
You can easily import data for your research from many sources. If your
research involves data from Federal Reserve Economic Data (FRED) or from
Haver Analytics databases, you can directly import data into Stata. You can
use any ODBC data source including Oracle, SQL Server, Access, MySQL, and
DB2, and you can perform custom SQL queries through ODBC. Or access
data from from Wharton Research Data Services (WRDS) via JDBC. Stata also
provides support for importing and exporting data in Excel, CSV, SPSS,
dBase, and a variety of other file types.
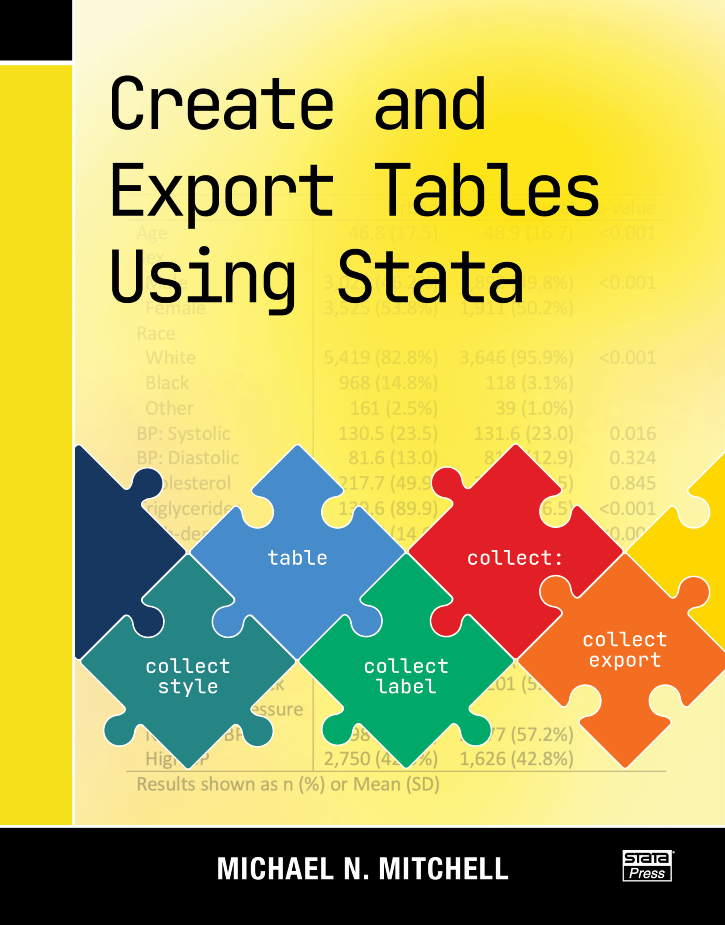
Automated reporting and customizable tables
Stata is designed for reproducible research, including the ability to
create dynamic documents incorporating your analysis results. Create
Word or PDF files, populate Excel worksheets with results and format
them to your liking, and mix Markdown, HTML, Stata results, and Stata
graphs, all from within Stata. Create tables that compare
regression results or summary statistics, use default styles
or apply your own, and export your tables to Word, PDF, HTML, LaTeX,
Excel, or Markdown and include them in your reports.
Reproducibility
Stata is the only software for data science and statistical analysis
featuring a comprehensive
integrated versioning
that ensures your code continues to run, unaltered, even after updates
or new versions are released. No need to keep around multiple legacy
installations to avoid breaking your system; Stata code from 40 years
ago can still be run without modification. Datasets, graphs, scripts,
programs, and more are 100% cross-platform and backward compatible.
Intuitive and easy to use.
Once you learn the syntax of one estimator, graphics command,
or data manipulation tool, you will effortlessly understand the rest.
Accuracy, reliability, and reproducibility.
Stata is extensively and continually tested.
Stata's tests produce
approximately 7.2 million lines of testing code. Each of
those lines is compared against known-to-be-accurate results
across editions of Stata and every operating system Stata supports to
ensure accuracy and reproducibility, including
integrated versioning
for backwards compatibility.
One package. No modules.
When you buy Stata, you obtain
everything for your statistical,
graphical, and data analysis needs. You do not need to buy separate modules
or import your data to specialized software.
Write your own Stata programs.
You can easily write your own Stata programs and commands. Share them
with others or use them to simplify your work. Utilize Stata's
do-files, ado-files, and Mata:
Stata's own advanced programming
language that adds direct support for matrix programming. You can also
access and benefit from the thousands of existing Stata
community-contributed programs.
Extensive documentation.
Stata offers 36 manuals with more than 19,000 pages of PDF documentation
containing detailed examples, in-depth discussions, references to relevant literature,
and methods and formulas. Stata's documentation is a great place to learn about
Stata and the statistics, graphics, data manipulation, and data science tools you
are using for your research.
Top-notch technical support.
Stata's technical support is known for their prompt, accurate,
detailed, and clear responses. People answering your questions have master's
and PhD degrees in relevant areas of research.
Join us for one of our free live webinars. Ready. Set. Go Stata shows you how to quickly get started manipulating, graphing, and analyzing your data. Or, go deeper in one of our special-topics webinars.
Stata's YouTube has over 300 videos with a dedicated playlist of methodologies important to economists. And, they are a convenient teaching aid in the classroom.
;)
Get started quickly at using Stata effectively, or even learn how to perform rigorous time-series, panel-data, or survival analysis, all from the comfort of you home or office. NetCourses make it easy.
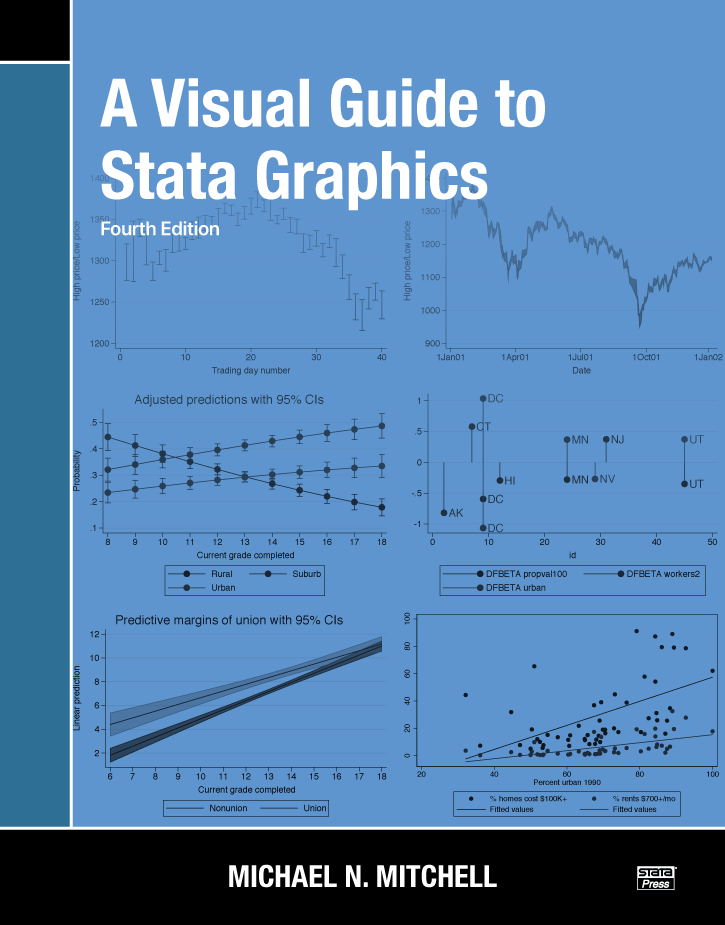
Stata Press offers books with clear, step-by-step examples that make teaching easier and that enable students to learn and researchers in finance, business, or marketing to implement the latest best practices in analysis.