In the spotlight: Export tables to Excel®
A new feature in Stata 13, putexcel, allows you to easily export matrices, expressions, and stored results to an Excel file. Combining putexcel with a Stata command’s stored results allows you to create the table displayed in your Stata Results window in an Excel file. Let me show you.
A stored result is simply a scalar, macro, or matrix stored in memory after you run a Stata command. The two main types of stored results are e-class (for estimation commands) and r-class (for general commands). You can list a command’s stored results after it has been run by typing ereturn list (for estimation commands) or return list (for general commands). Let’s try a simple example by loading the auto dataset and running correlate on the variables foreign and mpg:
. sysuse auto
(1978 Automobile Data)

. correlate foreign mpg
(obs=74)
| foreign mpg | ||
| foreign | 1.0000 | |
| mpg | 0.3934 1.0000 |
Because correlate is not an estimation command, we use return list to see its stored results.
. return list

scalars:
                  r(N) =  74
                r(rho) =  .3933974152205484

matrices:
                  r(C) :  2 x 2
Now we can use putexcel to export these results to Excel. The basic syntax of putexcel is
putexcel excel_cell=(expression) ... using filename [, options]
If you are working with matrices, the syntax is
putexcel excel_cell=matrix(expression) ... using filename [, options]
It is easy to build the above syntax in the putexcel dialog. We have a helpful video on our YouTube channel about the dialog. Let's list the matrix r(C) to see what it contains.
. matrix list r(C)

symmetric r(C)[2,2]
           foreign        mpg
foreign          1
    mpg  .39339742          1
To re-create the table in Excel, we need to export the matrix r(C) with the matrix row and column names. In your Stata Command window, type
. putexcel A1=matrix(r(C), names) using corr
To export the matrix row and column names, we used the names option after we specifed the matrix r(C). When we open the file corr.xlsx in Excel, the table below is displayed.

Next let’s try a more involved example. Reload the auto dataset, and run a tabulation on the variable foreign. Because tabulate is not an estimation command, we use return list to see its stored results.
. sysuse auto
(1978 Automobile Data)

. tabulate foreign
| Car type | Freq. Percent Cum. | |
| Domestic | 52 70.27 70.27 | |
| Foreign | 22 29.73 100.00 | |
| Total | 74 100.00 |
tabulate is different from most commands in Stata: it does not automatically save all the results we need into the stored results. We need to use the matcell() and matrow() options of tabulate to save its results into two Stata matrices.
. tabulate foreign, matcell(freq) matrow(names)
| Car type | Freq. Percent Cum. | |
| Domestic | 52 70.27 70.27 | |
| Foreign | 22 29.73 100.00 | |
| Total | 74 100.00 |
The putexcel commands below create a basic tabulation table in Excel.
. putexcel A1=("Car type") B1=("Freq.") C1=("Percent") using results, replace
. putexcel A2=matrix(names) B2=matrix(freq) C2=matrix(freq/r(N)) using results, modify
Here is the resulting Excel table:

You probably noticed that this table does not include cumulative percentages or the total number of cars. Moreover, our “Car type” column contains the numeric values of the foreign variable rather than the value labels Domestic and Foreign.
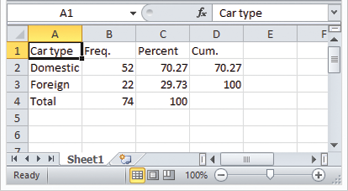
With a bit of programming, you can overcome these limitations. On the Stata Blog, I have posted a short do-file that exports the table by tabulate exactly as it appears in the Stata Results Window. With that program, we get this Excel spreadsheet:

In the blog post, I also provide a simple command that combines tabulate and putexcel into one handy command. I explain how to use putexcel to format the exported Excel tables in another blog post. You can also learn how to quickly export estimation results here.
—Kevin Crow
Senior Software Developer


