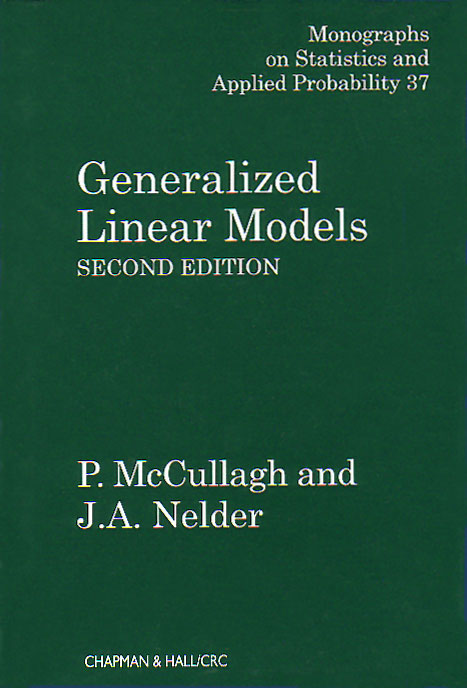

Generalized Linear Models, Second Edition |
||||||||||||||||||||||||||||||||
 Click to enlarge See the back cover |

As an Amazon Associate, StataCorp earns a small referral credit from
qualifying purchases made from affiliate links on our site.
eBook not available for this title
eBook not available for this title |
|
||||||||||||||||||||||||||||||
Comment from the Stata technical groupThis book covers the methodology of generalized linear models, which has evolved dramatically over the last 20 years as a way to generalize the methods of classical linear regression to more complex situations, including analysis-of-variance models, logit and probit models, log-linear models, models with multinomial responses for counts, and models for survival data. Although the original least-squares estimation for linear regression is based on Gaussian errors, the most important properties of least-squares estimates depend only on the assumed mean-to-variance relationship and on the statistical independence of the observations. This fact is exploited in developing the more general algorithm of iteratively reweighted least-squares to handle the more complex models. Considered by many to be the most thorough treatment on the topic, this text is organized to be accessible to the practicing research scientist with only the most basic knowledge of statistical theory. |
||||||||||||||||||||||||||||||||
Table of contentsView table of contents >> Preface to the first edition
Preface
1 Introduction
1.1 Background
1.1.1 The problem of looking at data
1.2 The origins of generalized linear models1.1.2 Theory as pattern 1.1.3 Model fitting 1.1.4 What is a good model?
1.2.1 Terminology
1.3 Scope of the rest of the book1.2.2 Classical linear models 1.2.3 R. A. Fisher and the design of experiments 1.2.4 Dilution assay 1.2.5 Probit analysis 1.2.6 Logit models for proportions 1.2.7 Log-linear models for counts 1.2.8 Inverse polynomials 1.2.9 Survival data 1.4 Bibliographic notes 1.5 Further results and exercises 1
2 An outline of generalized linear models
2.1 Processes in model fitting
2.1.1 Model selection
2.2 The components of a generalized linear model2.1.2 Estimation 2.1.3 Prediction
2.2.1 The generalization
2.3 Measuring the goodness of fit2.2.2 Likelihood functions 2.2.3 Link functions 2.2.4 Sufficient statistics and canonical links
2.3.1 The discrepancy of a fit
2.4 Residuals2.3.2 The analysis of deviance
2.4.1 Pearson residual
2.5 An algorithm for fitting generalized linear models2.4.2 Anscombe residual 2.4.3 Deviance residual
2.5.1 Justification of the fitting procedure
2.6 Bibliographic notes2.7 Further results and exercises 2 3 Models for continuous data with constant variance
3.1 Introduction
3.2 Error structure 3.3 Systematic component (linear predictor)
3.3.1 Continuous covariates
3.4 Model formulae for linear predictors3.3.2 Qualitative covariates 3.3.3 Dummy variates 3.3.4 Mixed terms
3.4.1 Individual terms
3.5 Aliasing3.4.2 The dot operator 3.4.3 The + operator 3.4.4 The crossing (*) and nesting (/) operators 3.4.5 Operators for the removal of terms 3.4.6 Exponential operator
3.5.1 Intrinsic aliasing with factors
3.6 Estimation3.5.2 Aliasing in a two-way cross-classification 3.5.3 Extrinsic aliasing 3.5.4 Functional relations among covariates
3.6.1 The maximum-likelihood equations
3.7 Tables as data3.6.2 Geometrical interpretation 3.6.3 Information 3.6.4 A model with two covariates 3.6.5 The information surface 3.6.6 Stability
3.7.1 Empty cells
3.8 Algorithms for least squares3.7.2 Fused cells
3.8.1 Methods based on the information matrix
3.9 Section of covariates3.8.2 Direct decomposition methods 3.8.3 Extension to generalized linear models 3.10 Bibliographic notes 3.11 Further results and exercises 3 4 Binary data
4.1 Introduction
4.1.1 Binary responses
4.2 Binomial distribution4.1.2 Covariate classes 4.1.3 Contingency tables
4.2.1 Genesis
4.3 Models for binary responses4.2.2 Moments and cumulants 4.2.3 Normal limit 4.2.4 Poisson limit 4.2.5 Transformations
4.3.1 Link functions
4.4 Likelihood functions for binary data4.3.2 Parameter interpretation 4.3.3 Retrospective sampling
4.4.1 Log likelihood for binomial data
4.5 Over-dispersion4.4.2 Parameter estimation 4.4.3 Deviance function 4.4.4 Bias and precision of estimates 4.4.5 Sparseness 4.4.6 Extrapolation
4.5.1 Genesis
4.6 Example
4.5.2 Parameter estimation
4.6.1 Habitat preferences of lizards
4.7 Bibliographic notes4.8 Further results and exercises 4 5 Models for polytomous data
5.1 Introduction
5.2 Measurement scales
5.2.1 General points
5.3 The multinomial distribution5.2.2 Models for ordinal scales 5.2.3 Models for interval scales 5.2.4 Models for nominal scales 5.2.5 Nested or hierarchical response scales
5.3.1 Genesis
5.4 Likelihood functions5.3.2 Moments and cumulants 5.3.3 Generalized inverse and matrices 5.3.4 Quadratic forms 5.3.5 Marginal and conditional distributions
5.4.1 Log likelihood for multinomial responses
5.5 Over-dispersion5.4.2 Parameter estimation 5.4.3 Deviance function 5.6 Examples
5.6.1 A cheese-tasting experiment
5.7 Bibliographic notes5.6.2 Pneumoconiosis among coalminers 5.8 Further results and exercises 5
6 Log-linear models
6.1 Introduction
6.2 Likelihood functions
6.2.1 Poisson distribution
6.3 Examples6.2.2 The Poisson log-likelihood function 6.2.3 Over-dispersion 6.2.4 Asymptotic theory
6.3.1 A biological assay of tuberculins
6.4 Log-linear models and multinomial response models6.3.2 A study of wave damage to cargo ships
6.4.1 Comparison of two or more Poisson means
6.5 Multiple responses6.4.2 Multinomial response models 6.4.3 Summary
6.5.1 Introduction
6.6 Example6.5.2 Independence and conditional independence 6.5.3 Canonical correlation models 6.5.4 Multivariate regression models 6.5.5 Multivariate model formulae 6.5.6 Log-linear regression models 6.5.7 Likelihood equations
6.6.1 Respiratory ailments of coalminers
6.7 Bibliographic notes6.6.2 Parameter interpretation 6.8 Further results and exercises 6 7 Conditional likelihoods*
7.1 Introduction
7.2 Marginal and conditional likelihoods
7.2.1 Marginal likelihood
7.3 Hypergeometric distributions7.2.2 Conditional likelihood 7.2.3 Exponential-family models 7.2.4 Profile likelihood
7.3.1 Central hypergeometric distribution
7.4 Some applications involving binary data7.3.2 Non-central hypergeometric distribution 7.3.3 Multivariate hypergeometric distribution 7.3.4 Multivariate non-central distribution
7.4.1 Comparison of two binomial probabilities
7.5 Some applications involving polytomous data7.4.2 Combination of information from 2x2 tables 7.4.3 Ille-et-Vilaine study of oesophageal cancer
7.5.1 Matched pairs: nominal response
7.6 Bibliographic notes7.5.2 Ordinal responses 7.5.3 Example 7.7 Further results and exercises 7 8 Models with constant coefficient of variation
8.1 Introduction
8.2 The gamma distribution 8.3 Models with gamma-distributed observations
8.3.1 The variance function
8.4 Examples8.3.2 The deviance 8.3.3 The canonical link 8.3.4 Multiplicative models: log link 8.3.5 Linear models: identity link 8.3.6 Estimation of the dispersion parameter
8.4.1 Car insurance claims
8.5 Bibliographic notes8.4.2 Clotting times of blood 8.4.3 Modelling rainfall data using two generalized linear models 8.4.4 Developmental rate of Drosophila melanogaster 8.6 Further results and exercises 8 9 Quasi-likelihood functions
9.1 Introduction
9.2 Independent observations
9.2.1 Covariance functions
9.3 Dependent observations9.2.2 Construction of the quasi-likelihood function 9.2.3 Parameter estimation 9.2.4 Example: incidence of leaf-blotch on barley
9.3.1 Quasi-likelihood estimating equations
9.4 Optimal estimating functions9.3.2 Quasi-likelihood function 9.3.3 Example: estimation of probabilities from marginal frequencies
9.4.1 Introduction
9.5 Optimality criteria9.4.2 Combination of estimating functions 9.4.3 Example: estimation for megalithic stone rings 9.6 Extended quasi-likelihood 9.7 Bibliographic notes 9.8 Further results and exercises 9 10 Joint modelling of mean and dispersion
10.1 Introduction
10.2 Model specification 10.3 Interaction between mean and dispersion effects 10.4 Extended quasi-likelihood as a criterion 10.5 Adjustments of the estimating equations
10.5.1 Adjustment for kurtosis
10.6 Joint optimum estimating equations10.5.2 Adjustment for degrees of freedom 10.5.3 Summary of estimating equations for the dispersion model 10.7 Example: the production of leaf-springs for trucks 10.8 Bibliographic notes 10.9 Further results and exercises 10 11 Models with additional non-linear parameters
11.1 Introduction
11.2 Parameters in the variance function 11.3 Parameters in the link function
11.3.1 One link parameter
11.4 Non-linear parameters in the covariates11.3.2 More than one link parameter 11.3.3 Transformation of data vs transformation of fitted values 11.5 Examples
11.5.1 The effects of fertilizers on coastal Bermuda grass
11.6 Bibliographic notes11.5.2 Assay of an insecticide with a synergist 11.5.3 Mixtures of drugs 11.7 Further results and exercises 11 12 Model checking
12.1 Introduction
12.2 Techniques in model checking 12.3 Score tests for extra parameters 12.4 Smoothing as an aid to informal checks 12.5 The raw materials of model checking 12.6 Checks for systematic departure from model
12.6.1 Informal checks using residuals
12.7 Checks for isolated departures from the model12.6.2 Checking the variance function 12.6.3 Checking the link function 12.6.4 Checking the scales of covariates 12.6.5 Checks for compound discrepancies
12.7.1 Measure of leverage
12.8 Examples12.7.2 Measure of consistency 12.7.3 Measure of influence 12.7.4 Informal assessment of extreme values 12.7.5 Extreme points and checks for systematic discrepancies
12.8.1 Carrot damage in an insecticide experiment
12.9 A strategy for model checking?12.8.2 Minitab tree data 12.8.3 Insurance claims (continued) 12.10 Bibliographic notes 12.11 Further results and exercises 12 13 Models for survival data
13.1 Introduction
13.1.1 Survival functions and hazard functions
13.2 Proportional-hazards models13.3 Estimation with a specified survival distribution
13.3.1 The exponential distribution
13.4 Example: remission times for leukaemia13.3.2 The Weibull distribution 13.3.3 The extreme-value distribution 13.5 Cox's proportional-hazards model
13.5.1 Partial likelihood
13.6 Bibliographic notes13.5.2 The treatment of ties 13.5.3 Numerical methods 13.7 Further results and exercises 13 14 Components of dispersion
14.1 Introduction
14.2 Linear models 14.3 Non-linear models 14.4 Parameter estimation 14.5 Example: A salamander mating experiment
14.5.1 Introduction
14.6 Bibliographic notes14.5.2 Experimental procedure 14.5.3 A linear logistic model with random effects 14.5.4 Estimation of the dispersion parameters 14.7 Further results and exercises 14
15 Further topics
15.1 Introduction
15.2 Bias adjustment
15.2.1 Models with canonical link
15.3 Computation of Bartlett adjustments15.2.2 Non-canonical models 15.2.3 Example: Lizard data (continued)
15.3.1 General theory
15.4 Generalized additive models15.3.2 Computation of the adjustment 15.3.3 Example: exponential regression model
15.4.1 Algorithms for fitting
15.5 Bibliographic notes15.4.2 Smoothing methods 15.4.3 Conclusions 15.6 Further results and exercises 15 Appendices
A Elementary likelihood theory
B Edgeworth series C Likelihood-ratio statistics References
Index of data sets
Author index
Subject index
|
||||||||||||||||||||||||||||||||
Learn
Free webinars
NetCourses
Classroom and web training
Organizational training
Video tutorials
Third-party courses
Web resources
Teaching with Stata
© Copyright 1996–2025 StataCorp LLC. All rights reserved.
×
We use cookies to ensure that we give you the best experience on our website—to enhance site navigation, to analyze usage, and to assist in our marketing efforts. By continuing to use our site, you consent to the storing of cookies on your device and agree to delivery of content, including web fonts and JavaScript, from third party web services.
Cookie Settings
Last updated: 16 November 2022
StataCorp LLC (StataCorp) strives to provide our users with exceptional products and services. To do so, we must collect personal information from you. This information is necessary to conduct business with our existing and potential customers. We collect and use this information only where we may legally do so. This policy explains what personal information we collect, how we use it, and what rights you have to that information.
These cookies are essential for our website to function and do not store any personally identifiable information. These cookies cannot be disabled.
This website uses cookies to provide you with a better user experience. A cookie is a small piece of data our website stores on a site visitor's hard drive and accesses each time you visit so we can improve your access to our site, better understand how you use our site, and serve you content that may be of interest to you. For instance, we store a cookie when you log in to our shopping cart so that we can maintain your shopping cart should you not complete checkout. These cookies do not directly store your personal information, but they do support the ability to uniquely identify your internet browser and device.
Please note: Clearing your browser cookies at any time will undo preferences saved here. The option selected here will apply only to the device you are currently using.